Your campaign data isn't just numbers. It tells the story of how your outreach is performing. The Campaign Analytics dashboard in Seleqt gives you a clear view of how your messages are being delivered, received, and responded to.
We’ll walk you through the key metrics, what they mean, and how to use them to improve your outreach strategy.
Pro tip: You can click on any key metric to view the people behind the numbers, see who was contacted, messaged, accepted your invite, or replied.
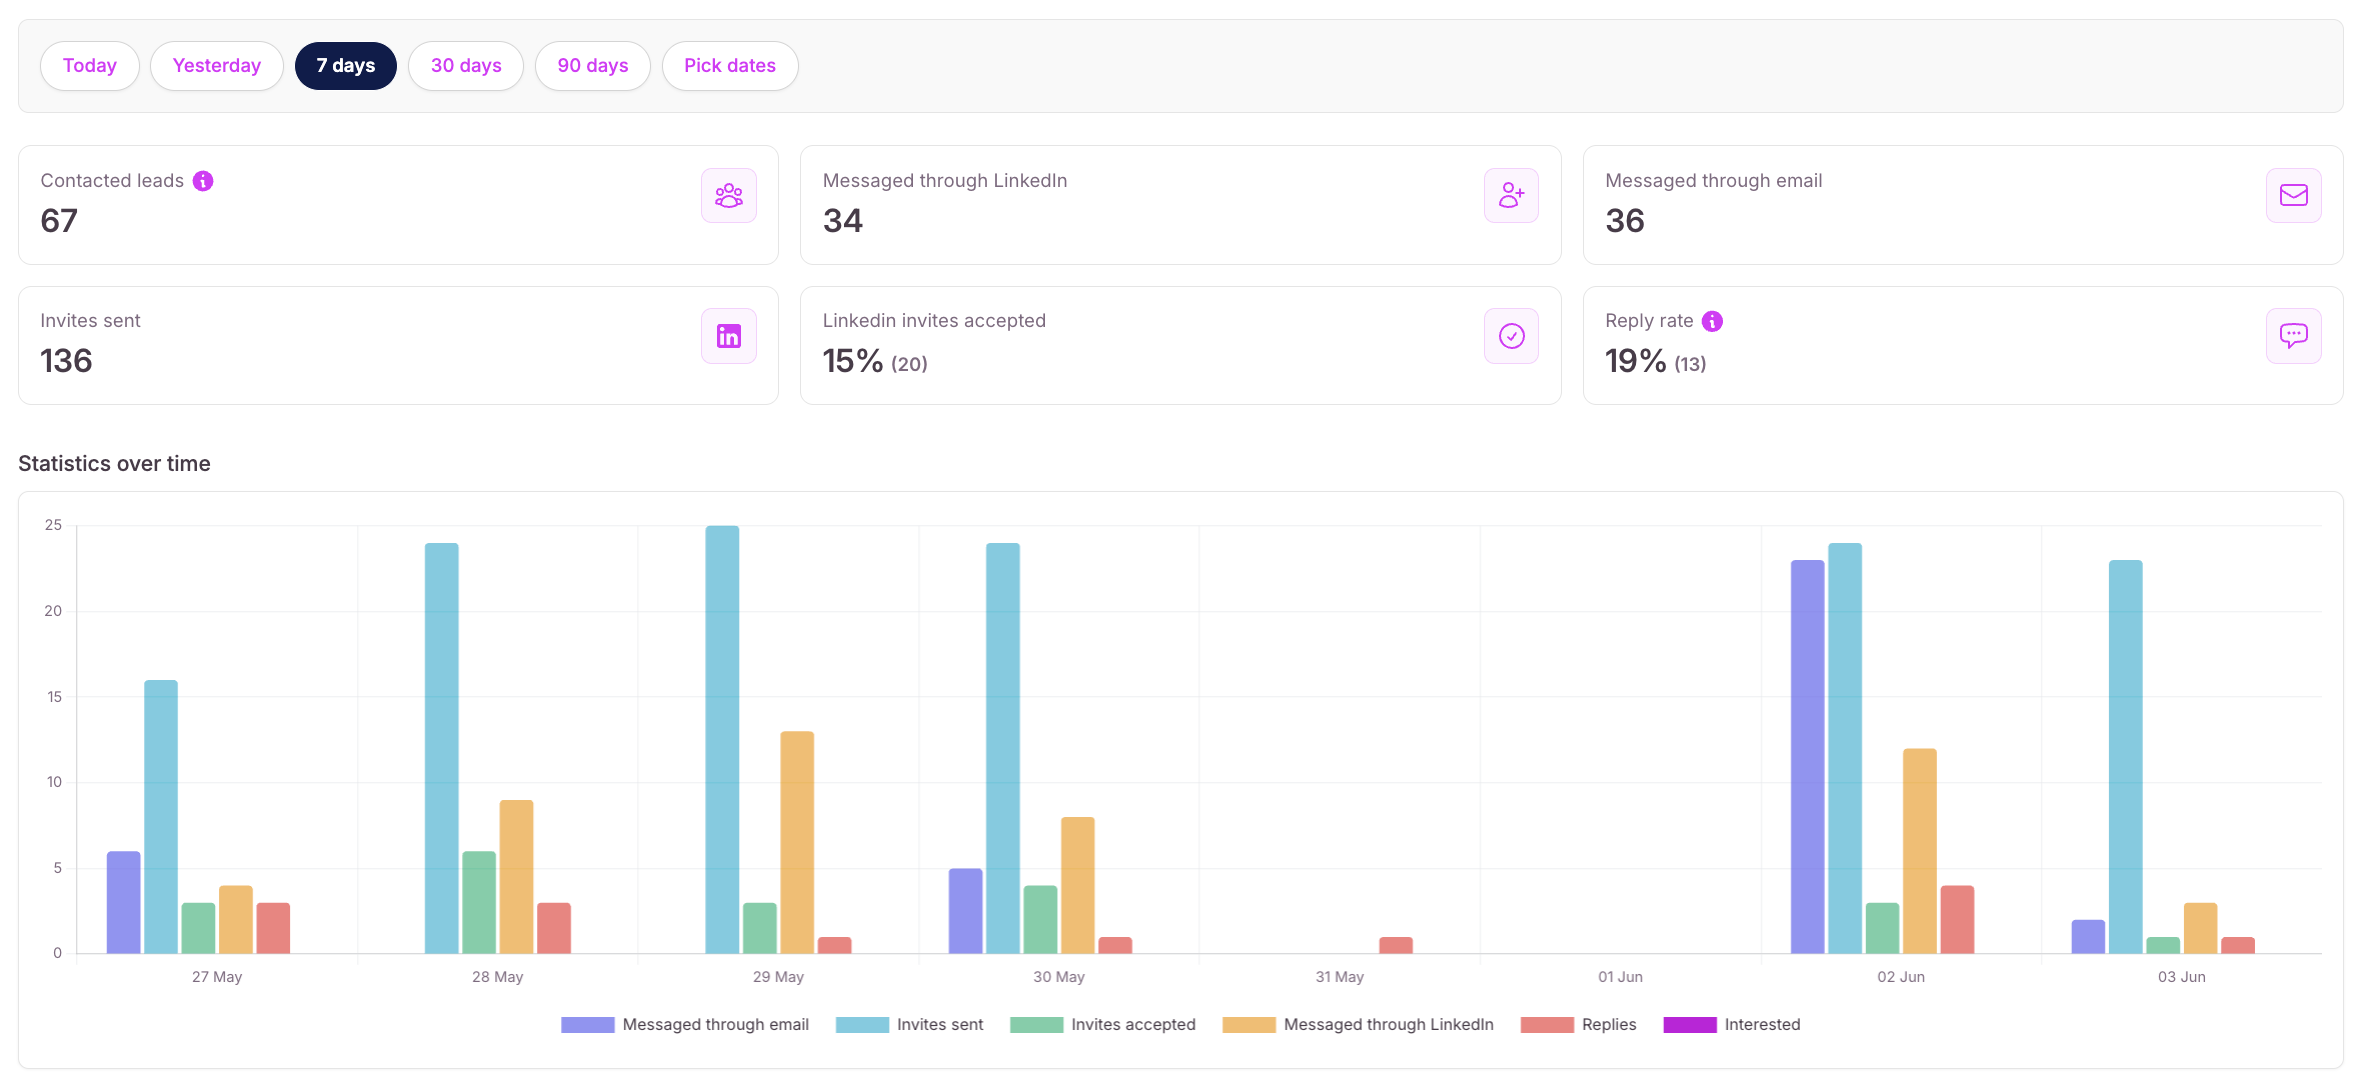
Here’s a breakdown of the performance metrics available in your campaign analytics:
This shows how many unique leads were contacted during the campaign. It represents the total pool of prospects reached through LinkedIn, email, or both.
The number of contacts who received your LinkedIn messages.
The number of leads who were reached via email.
This tracks how many LinkedIn connection requests were sent.
The percentage of sent invites that were accepted.
This is the percentage of contacted leads who responded to your message across both LinkedIn and email.
This is one of your most important engagement metrics. A reply rate above 15% is generally solid; above 25% is excellent.
Optimize Channels: If LinkedIn messages outperform emails (or vice versa), consider adjusting your outreach mix.
Improve Messaging: Low reply or acceptance rates? Test new subject lines, personalize intros, or reduce message length.
Focus on Follow-ups: Many replies come after a second or third touch, don’t stop after one message.
Target Better: Low acceptance rates might mean you're contacting the wrong personas. Revisit your lead filters.